The Competition Analysis Tactic That Exposed Why They Are Outranking You
The Competition Analysis Tactic That Exposed Why They Are Outranking You
For years, I have sat across the table from business owners who are visibly frustrated. They have spent thousands on SEO agencies, they have checked their rankings every morning from their office desktop, and they see their business sitting at the number one spot. Yet, the phone isn’t ringing. The leads aren’t coming in. The “leads” they were promised have turned out to be nothing more than digital ghosts.
When I dig into their data, the problem is almost always the same: they are victims of the “Ranking Illusion.” They believe that because they rank well in one specific spot – usually their own office – they are dominating their city. This is the fundamental flaw in modern local marketing strategy. In this guide, I’m going to expose the exact local competition analysis tactic I use to show my clients why their competitors are actually eating their lunch, and more importantly, how we use that data to flip the rankings in their favor.
Section 1: The “False Hope” of Standard Rank Tracking
If you are still relying on a rank tracker that gives you a single number for a keyword, you are flying blind. Most standard rank trackers simulate a search from a static IP address or a general zip code. While this might work for national e-commerce brands, it is utterly useless for local service providers like plumbers, lawyers, or HVAC contractors.
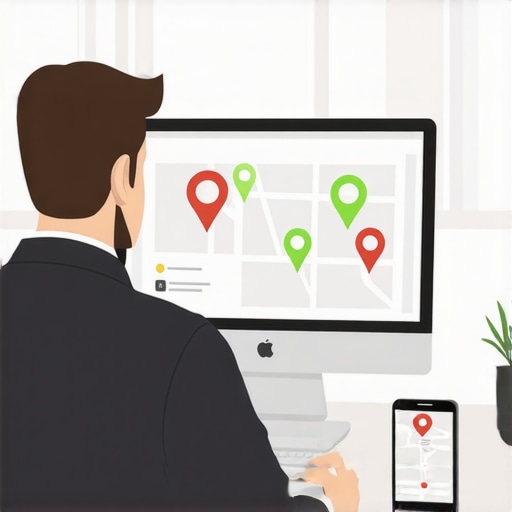
Google’s local algorithm is built on three pillars: Relevance, Prominence, and – most importantly – Proximity. Proximity is the ultimate “gatekeeper.” Google wants to show the user the most relevant result that is also physically closest to them. This creates a “ranking radius.” You might be #1 when someone searches from the coffee shop next door to your office, but move three blocks away, and you might drop to #14. This is a phenomenon I discuss at length in my analysis of Why Your Local Rank Tracker Might Be Giving You False Hope.
Data shows that local searches are the primary driver for service-based businesses, with over 46% of all Google searches having local intent. However, if your visibility is limited to a one-mile “bubble” around your physical address, you are missing 90% of your potential market. The competition is outranking you not because they have a “better” business, but because they have optimized their profile to maintain relevance across a wider geographic area. To beat them, we have to stop looking at lists and start looking at grids.
[Image: A heat map showing a business ranking #1 in the center but dropping to #10 just two miles away, illustrating the “ranking bubble” effect.]
Section 2: The Tactic – Neighborhood-Level Grid Analysis
The “secret weapon” in my consulting arsenal is the Neighborhood-Level Grid Analysis. Instead of checking a rank for “Personal Injury Lawyer Houston,” we visualize the ranking across a 5×5 or 10×10 mile grid, with data points every half-mile. This is where the truth comes out.
To perform this, you need a professional google maps rank tracker. When you run a grid report, you will often see a sea of red (low rankings) surrounding a tiny island of green (high rankings) where your office is located. Your competitor, however, might have a grid that is 80% green.
Why does this happen? Usually, it’s because the competitor has established “Geographic Relevance” in specific neighborhoods. They aren’t just “a plumber in London”; they are the plumber who has verified jobs, localized content, and neighborhood-specific reviews in Chelsea, Kensington, and Fulham. By using The Aggressive Competition Analysis Tactics That Finally Flipped Our Rankings, we can identify exactly where a competitor’s “shield” is weak. If they dominate the North side of town but are non-existent in the South, that is your opening. We don’t try to fight them where they are strongest; we expand your grid into the “soft” areas first to build the momentum needed to eventually take their crown.
This technical visualization allows us to see the “why” behind the “where.” If a competitor ranks #1 five miles away from their office, we look at what happened in that specific grid point. Are there localized backlinks? Are there mentions of that neighborhood in their reviews? The grid doesn’t just show you where you’re losing; it provides the roadmap for where you need to work.
Section 3: The Category Gap – Why Primary Categories Rule
One of the most common reasons a competitor outranks you – even if you have more reviews and a better website – is the Category Gap. Google allows you to choose one primary category and up to nine secondary categories for your Google Business Profile (GBP). Most business owners treat this like a “set it and forget it” task. That is a massive mistake.
Recent research from BrightLocal confirms that choosing the right primary category is the single most important on-page factor for google business profile seo. If you are a “Personal Injury Attorney” but your primary category is set to “Lawyer,” you are diluting your relevance for your most profitable keywords. Your competitor, who has specifically chosen “Trial Attorney” or “Legal Service,” might be catching the semantic tailwinds that you are missing.
But the real “exposure” happens when we look at secondary categories. Google doesn’t display these publicly on your profile, but they are visible in the underlying code. By using specialized local seo tools, we can scrape the secondary categories of the top three businesses in the Map Pack. Often, we find that the leader is using a specific combination of categories that signals “authority” to Google’s AI. For example, a restoration company might use “Water Damage Restoration Service” as their primary, but their secondary categories include “Fire Damage Restoration,” “Building Restoration Service,” and “Carpet Cleaning.” This “cluster” tells Google they are a comprehensive solution, not just a one-trick pony. For more on how to fix these technical errors, see The 4 Overlooked Maps SEO List Fixes That Beat the Map Pack.
[Image: A side-by-side comparison of two Google Business Profiles, one with optimized categories and one with generic categories, highlighting the “Category Gap”.]
Section 4: Semantic Clustering & The 50% Traffic Boost
In 2025, Google has moved far beyond simple keyword matching. The algorithm now utilizes advanced Natural Language Processing (NLP) to understand the “entities” associated with your business. This is where “Semantic Clustering” comes into play.
A study published in the Journal of Search Engine Optimization (2024) found that businesses that implemented semantic clustering on their websites and GBP posts saw a local traffic increase of over 50%. What does this mean in plain English? Google no longer just looks for the word “Plumber.” It looks for a ecosystem of related terms. If your website and profile mention “Emergency pipe repair,” “Water heater installation,” “Tankless systems,” and “Drain cleaning,” Google views you as a high-authority entity in the plumbing space.
Your competitors are often outranking you because their content is semantically “thicker.” They aren’t just spamming keywords; they are answering the questions that Google knows users ask. To combat this, you need to audit your competitor’s “Services” section in their GBP. See which specific service descriptions they are using. Are they using long-tail variations that you’ve ignored? We then mirror this strategy by creating localized service pages on your site that link directly back to those specific services on your profile. This creates a “relevance loop” that is incredibly hard for competitors to break. I’ve detailed this process in our guide on How We Optimized a Business Profile for Proximity Without Spamming Keywords.
Section 5: Hyperlocal Backlinks vs. High-DA Noise
One of the biggest lies in the SEO industry is that you need “High DA” (Domain Authority) links to rank on Google Maps. I have seen businesses with a DA of 10 outrank businesses with a DA of 70 in the Map Pack. Why? Because the DA 10 business had “Geographic Relevance.”
Google’s local algorithm prioritizes links from entities that are physically located near you. A link from a local neighborhood Little League site, a community center blog, or the local Chamber of Commerce carries ten times the weight of a guest post on a national tech blog. When I perform a competition analysis, I use GBP ranking tools to look at the “Geographic Footprint” of a competitor’s backlink profile.
If your competitor is ranking in a neighborhood three miles away, they likely have a local citation or a link from a business in that specific area. This is “Hyperlocal Link Building.” It’s not about the quantity of links; it’s about the “Local Density.” To beat them, you need to stop buying “SEO packages” and start investing in your community. Sponsor a local 5k, get mentioned in the local parish newsletter, or partner with a non-competing business down the street for a cross-promotion. These are the signals that tell Google you are a pillar of the local community, not just a digital entity trying to “game” the system.
[Image: A diagram showing a “Hyperlocal Link Map” where local community links are weighted more heavily than distant high-authority links for Map Pack rankings.]
Section 6: Behavioral Signals – The “Ghost” Ranking Factor
Have you ever seen a business with 10 reviews and a 4.2 rating outrank a business with 500 reviews and a 4.9 rating? Most people think it’s a glitch. It isn’t. It’s the result of Behavioral Signals – the “ghost” factors that Google tracks but doesn’t explicitly talk about in their documentation.
These signals include:
- Click-Through Rate (CTR): How many people click your profile vs. the others when you appear in search?
- Directions Requests: How many people actually hit the “Directions” button? This is a massive signal of real-world intent.
- Dwell Time: How long do people stay on your profile? Do they look at your photos? Do they read your Q&A?
- Brand Search Volume: Are people searching for your business by name after seeing your profile?
Your competitors might be outranking you because their profile is more “engaging.” Maybe their primary photo is a high-quality shot of their team rather than a generic building exterior. Maybe they have a robust “Q&A” section that answers common customer objections. Google sees this engagement and concludes that users prefer that result, regardless of the review count. This is one of the 7 Hidden Local Ranking Factors Most Agencies Ignore. If you want to rank higher on google maps, you have to optimize for the human, not just the bot.
Section 7: The 2025/2026 Action Plan
The days of “set it and forget it” local SEO are dead. To dominate your market in 2025 and 2026, you need a proactive, data-driven strategy. Stop guessing why you aren’t ranking and start using the tools that reveal the truth.
Here is your 4-step audit process:
- Perform a Grid-Based Audit: Use a local seo software to see your true ranking radius. Identify the “dead zones” where your competitors are winning.
- Conduct a Category Gap Analysis: Scrape the primary and secondary categories of the top three competitors. Align your GBP categories to match the industry leaders while ensuring they accurately reflect your services.
- Update Your Semantic Content: Audit your “Services” and “Products” sections. Ensure you are using the NLP-friendly clusters that Google expects for your industry.
- Acquire Hyperlocal Authority: Look for link opportunities within a 5-mile radius of your office. Focus on community relevance over domain authority.
The competition isn’t “better” than you; they just have a clearer picture of the battlefield. By exposing their tactics through rigorous analysis, you can reclaim your territory and ensure that when a customer searches for your services, it’s your phone that rings. For a complete roadmap to dominance, be sure to Master the Local SEO Checklist 2025: Boost Your Visibility Today.
[Image: A checklist graphic summarizing the 4-step audit process for local SEO dominance.]